Objective
DNS is one of the highest-value, lowest-cost telemetry sources a defender has — nearly every action on a network begins with a DNS lookup. The goal of this lab: capture every DNS query on my home network in Pi-hole, ship the logs into Splunk Enterprise in real time, extract structured fields (client, query type, domain, action), and build a dashboard that answers the questions a SOC would ask — what’s being queried, by whom, and what’s being blocked.
Tools & Technologies
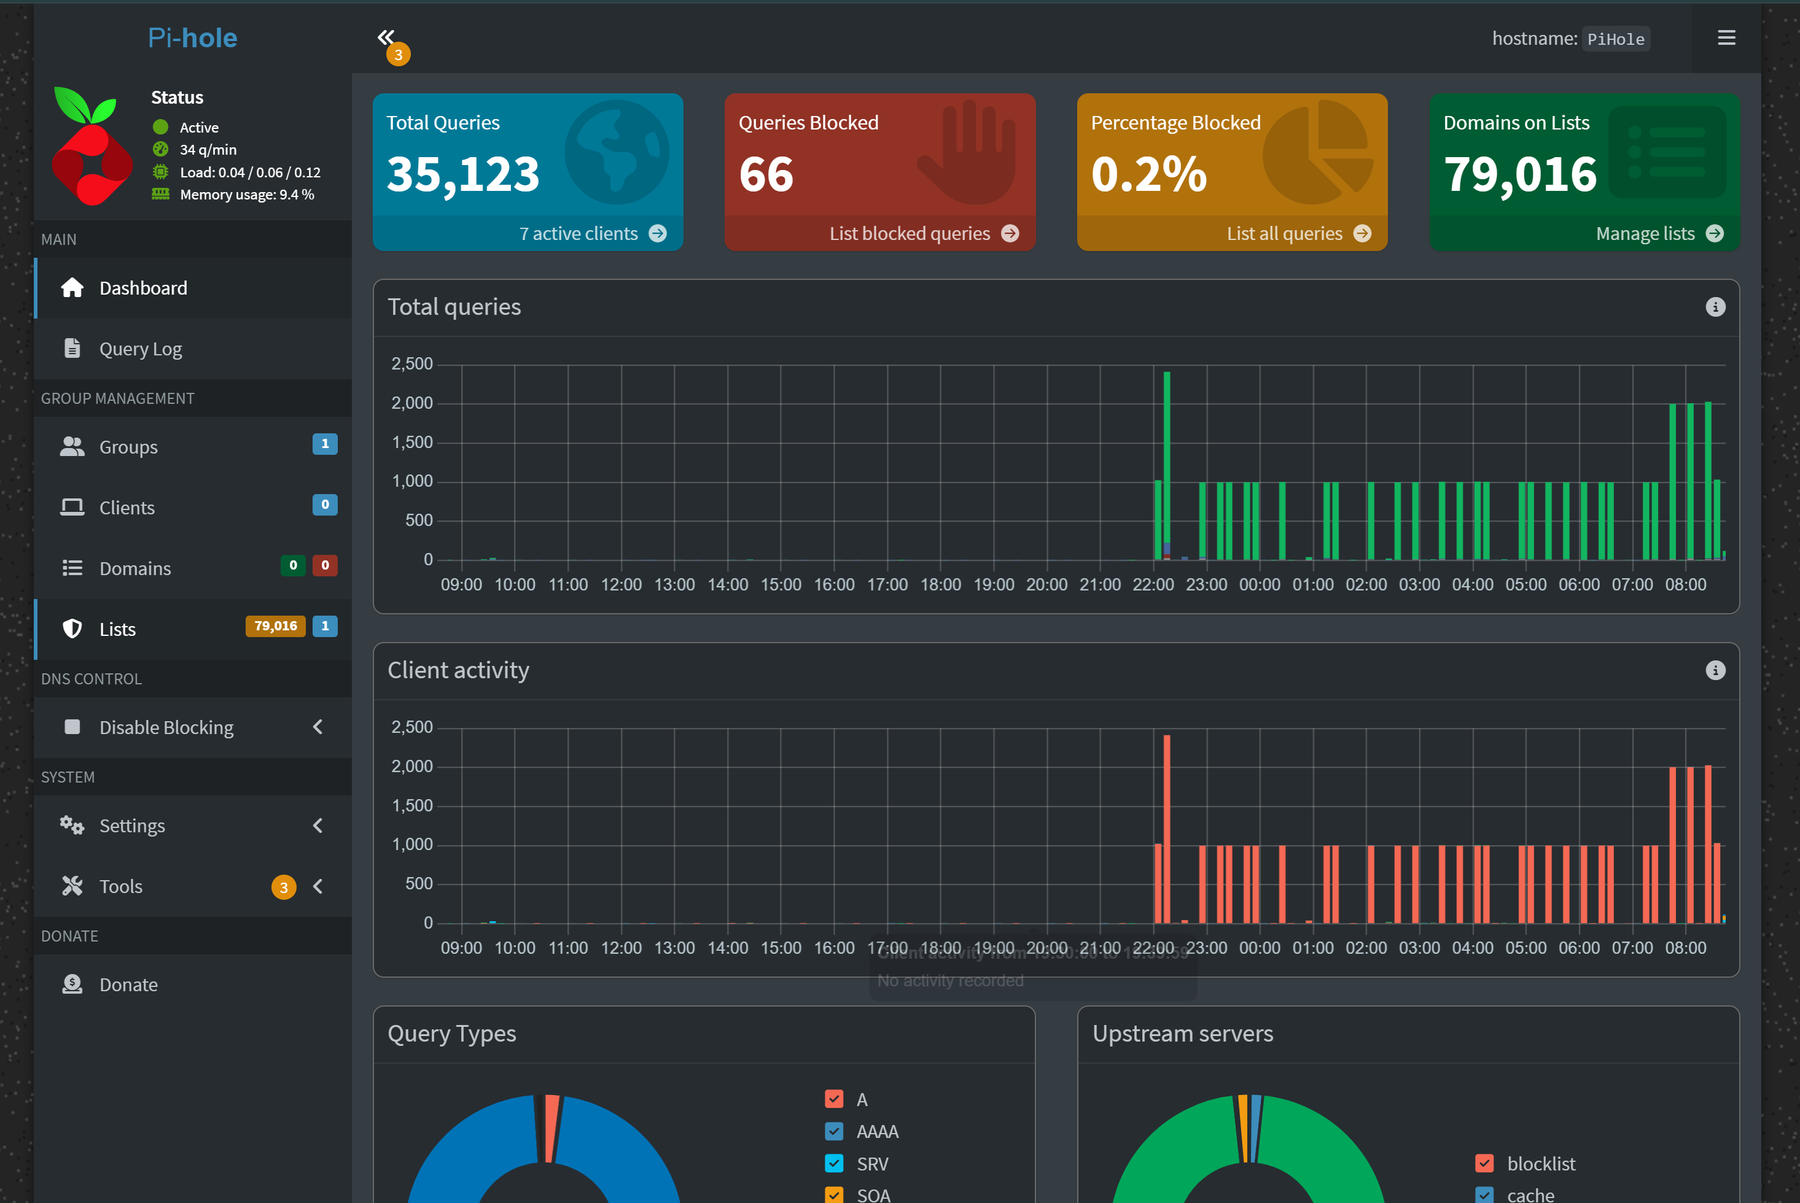
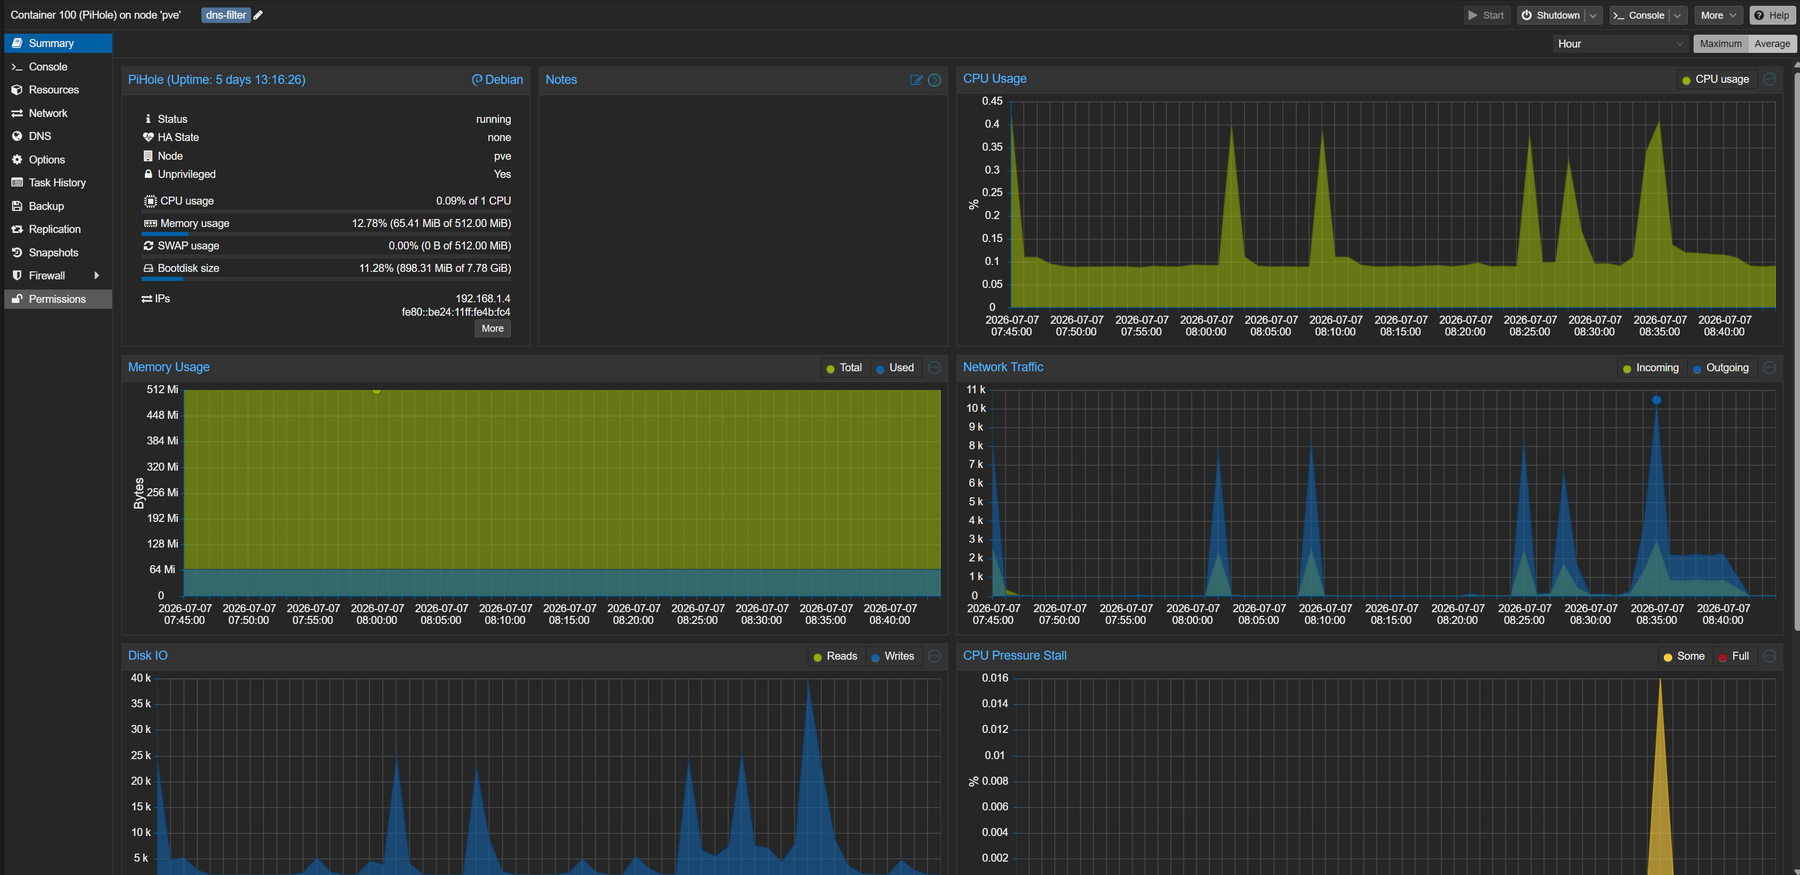
- Pi-hole running as an unprivileged LXC container (CT100) on Proxmox VE — the network’s DNS resolver and ad/tracker filter, 79,000+ domains on blocklists
- Splunk Enterprise on a dedicated VM (VM101) — the SIEM receiving and indexing all lab telemetry
- syslog-ng on the Pi-hole container — tails the dnsmasq query log and forwards it over the network
- SPL + regex — inline field extraction and dashboard searches
Architecture
Pi-hole (CT100, 192.168.1.4)
  └─ dnsmasq writes /var/log/pihole/pihole.log
       └─ syslog-ng tails the log file
            └─ UDP 515 → Splunk (VM101, 192.168.1.50)
                 └─ index=home, sourcetype=pihole
The router’s own syslog travels a parallel pipeline (UDP 514, sourcetype=syslog) into the same index, keeping DNS telemetry and infrastructure logs separated by sourcetype but correlatable in one place.
What I Configured
1. Log forwarding. syslog-ng on the Pi-hole container uses a file() source to tail pihole.log and a network() destination pointing at the Splunk VM on UDP 515. Splunk listens with a UDP data input bound to that port with sourcetype=pihole and index=home.
2. Verifying the raw events. Before writing any extraction, I confirmed what the events actually look like end to end — the syslog-ng wrapper prepends its own header before the dnsmasq message:
Jul  7 08:15:35 192.168.1.4 ... PiHole ... dnsmasq[172]: query[AAAA] log.tailscale.com from 192.168.1.1
Jul  7 08:15:35 192.168.1.4 ... PiHole ... dnsmasq[172]: forwarded log.tailscale.com to 1.1.1.1
Jul  7 08:15:35 192.168.1.4 ... PiHole ... dnsmasq[172]: reply log.tailscale.com is 2606:b740:1:20::103
3. Field extraction with inline regex. I anchored all patterns on the dnsmasq[pid]: message body so the syslog prefix never matters. Query events yield query_type, domain, and client_ip:
index=home sourcetype=pihole "query["
| rex "query\[(?<query_type>[^\]]+)\]\s+(?<domain>\S+)\s+from\s+(?<client_ip>\S+)"
| stats count by client_ip, query_type, domain
A second pattern classifies every event by dnsmasq action — the backbone of the dashboard:
index=home sourcetype=pihole
| rex "dnsmasq\[\d+\]:\s+(?<action>query|forwarded|reply|cached|gravity blocked|exactly blocked|config)"
| stats count by action
Validated against ~43,700 events over 24 hours: 19,700 queries, 18,639 forwards, 2,173 replies, 1,264 cache hits, and 53 gravity blocks resolved cleanly into their actions.
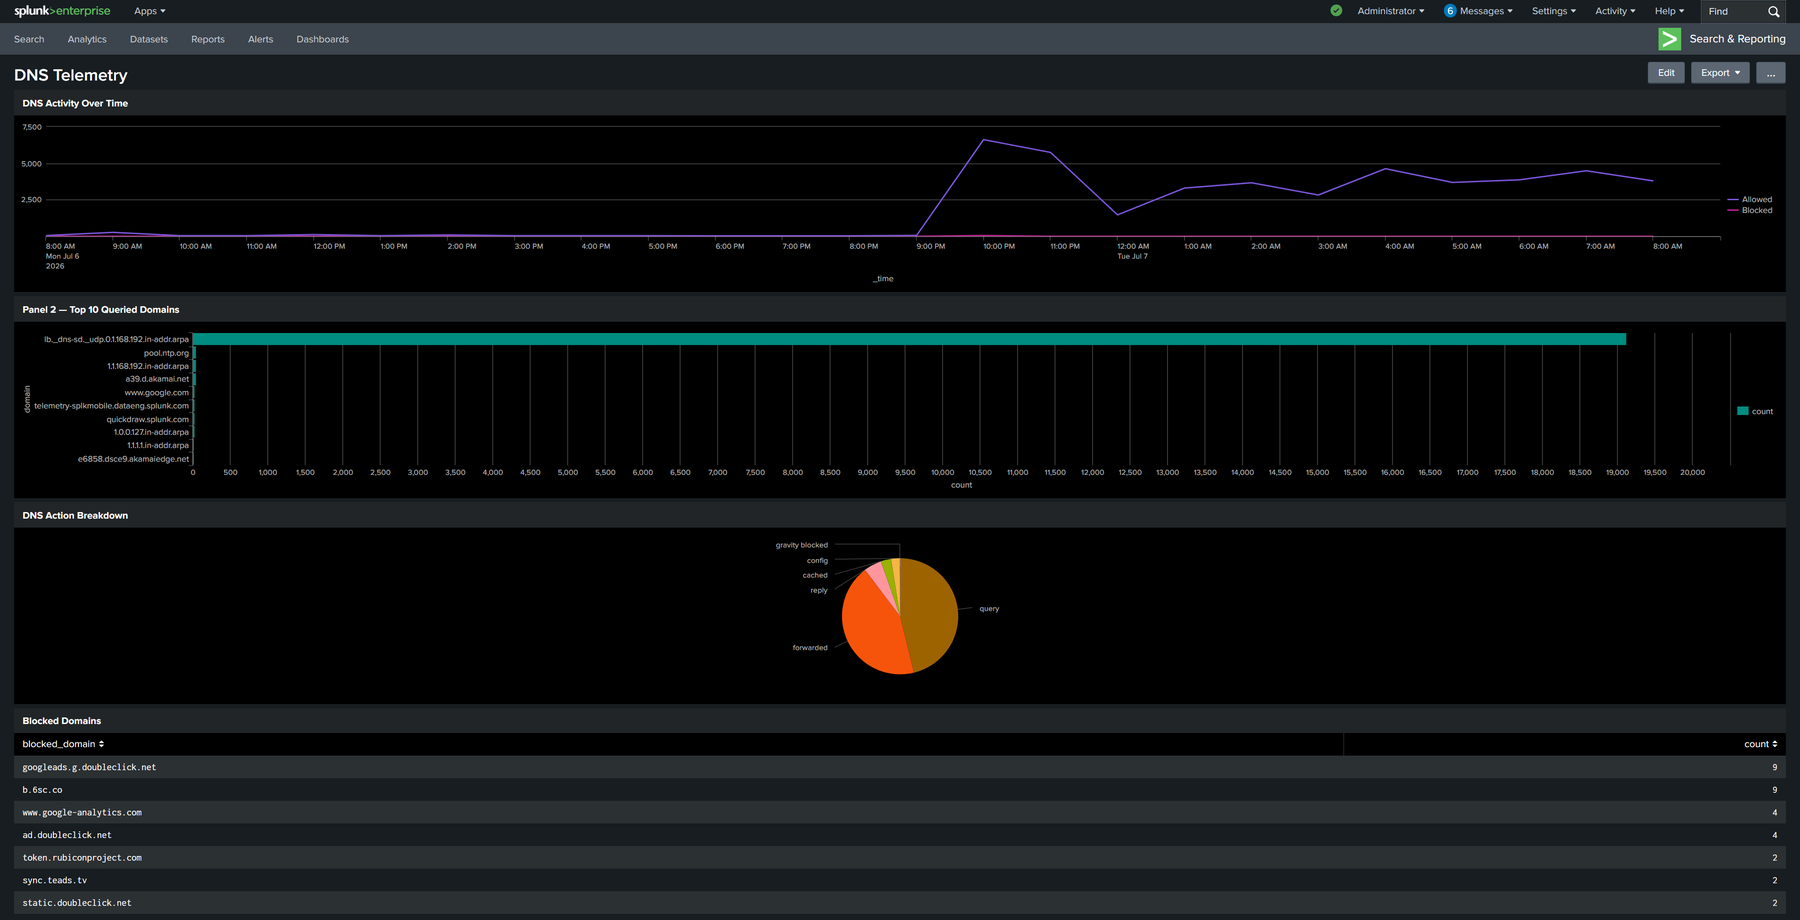
4. The dashboard. Four panels on a dark-theme Splunk dashboard titled DNS Telemetry: blocked-vs-allowed activity over time (timechart), top 10 queried domains, DNS action breakdown (pie), and a table of blocked domains.
Evidence
Key Findings
- mDNS noise dominates. The single most-queried “domain” was
lb._dns-sd._udp.0.1.168.192.in-addr.arpa— multicast DNS service discovery reverse lookups, outnumbering real domains by an order of magnitude. Real dashboards need this filtered or it drowns the signal — the same lesson as tuning any production SIEM. - Blocks are rare but real. A 0.2% block rate sounds small until you see the table:
googleads.g.doubleclick.net,google-analytics.com, ad-sync trackers — steady background tracking traffic from everyday devices. - Reverse-DNS chatter from the resolver itself (PTR lookups from 127.0.0.1) is a distinct traffic class worth separating from client-originated queries.
Skills Demonstrated
Log pipeline engineering (file tail → syslog → UDP input), Splunk data onboarding and sourcetyping, regex field extraction, SPL (rex, stats, timechart, top, eval), dashboard development, and the analyst habit of validating raw data before building on it.
What I Learned
The extraction workflow matters as much as the extraction: prove the pattern against real events with rex first, watch the stats output for values that shouldn’t exist, and only then commit. I also learned that “the log format in the documentation” and “the log format arriving at the SIEM” are two different things — the syslog-ng wrapper header would have broken any regex anchored at line start.
Next Steps
- Promote the validated inline patterns into
props.confas permanent search-time extractions - Normalize the two block actions (
gravity blocked,exactly blocked) into a singledisposition=blockedfield withtransforms.conf - Filter mDNS/PTR noise into a separate view so client-behavior panels show real browsing patterns
- Add scheduled alerts — e.g., spikes in blocked queries from a single client, or queries to newly-seen domains